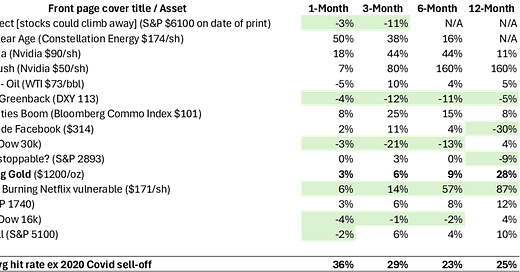
With gold featuring in the latest Barron’s magazine front cover, some are pointing that this signals the end of the metal’s bull-run.
The argument that this is a conclusive contrarian signal is based on myth in our view.
Indeed, we checked how various assets in question performed after featuring in their front covers. In most cases, the magazine had good calls, which may come as a surprise. Indeed, the contrarian signal worked in less than 40% of the cases, whether in the following 1m or 12m timeframes.
Barron’s magazine front page covers and associated asset performances that followed
Source: Asymmetric Research
What really breaks a gold bull-run…
The gold price decline over the past week is foremost technically driven. It was overbought. Overall, the structural trend for gold remains higher, in our opinion. As we had written in our report Gold is heading (much) higher – 1970s playbook, stagflation proved to be very bullish gold at the time. Gold rose in nominal terms by 5x in the period 1973-83 vs S&P +50%. It even held up through recession periods, albeit with volatility. During the timeframe, the gold price ran up as inflation printed higher and ran higher into the start of recessions. What broke the gold bull-runs back then, were post-recession periods where there was: a) the belief that the FED had successfully dealt with inflation AND b) real GDP growth was trending well-above average (2x average). In our opinion, this is far off. For a detailed analysis on this, please read our above-mentioned report from 11 March.
Meanwhile, as we described in a note last week, a select group of quality gold stocks are currently discounting a conservative gold price of $2600-2800/oz well below spot, and so, offer large upside leverage in a sustained gold bull-market while offering downside valuation cushion.


