


Gold is heading (much) higher – 1970s playbook

The risk of stagflation has come to the forefront and hit the markets. We look back at the at the period from late 1960s to early 1980s, a time which we argue is similar to the one we are in. At the time, stagflation proved to be very bullish gold. Gold rose in nominal terms by 5x in the period 1973-83 vs S&P +50%. It even held up through recession periods, albeit with volatility. During the timeframe, the gold price ran up as inflation printed higher and ran higher into the start of recessions. The gold price only corrected after the first rate hike within a new recession hiking-cycle, with an average price drop of -19%. However, such declines proved temporary, and the gold price then recovered entirely and almost as quickly as it fell.
What broke the gold bull runs at the time, were post-recession periods where there was: a) the belief that the FED had successfully dealt with inflation AND b) real GDP growth was trending well-above average (2x average). To us this is clearly far off.
In fact, an inflation re-acceleration could make this bull run superior to the 70s in our view, given much higher debt levels today constraining the capacity of the system to withstand higher for longer rates.
The gold equities offer a win-win here in our opinion. The peer group we look at discounts a gold price of cUSD2500-2550/oz, well below spot. In other words, they present compelling risk/reward with limited downside even in the case of a recession, and significant upside at spot with massive optionality once the bull market is in vogue.
Stagflation is bullish gold
Key takeaways from the ‘70s period
Gold rose in nominal terms by 5x in the period 1973-83 vs S&P +50%
The gold price rose as inflation printed higher
There were effectively 4 stagflation periods, with growth troughing in: 1970, 1974, 1980 and 1982. Growth and inflation respectively came at: 0%/6%; -1%/11%; -0.3%/13%; -2%/6%. It should be highlighted that 1970, 1974 and 1980 were also the years in which inflation had reached new highs. In 1982, while inflation stayed elevated (6%), it had peaked in 1980 at 13%.
The mean duration of the recessionary periods was 12 months
The FED kept on raising rates into these recessionary periods up until around 4 months after the start of the recession
The gold price made new nominal highs as you entered the recession, in all cases ex 1982 (it had peaked in 1980)
The gold price only really dropped after the first FED rate hike, inside a recession
The gold price declined in the first 3 months following the start of the recession by -19% on average
But in every case, the gold price then fully recovered this preceding drop, over the following 4 months; thus, recovering almost as quickly as dropped
Gold bull runs were broken in 1975-1976 and in the decade post 1983. These were times coinciding with post-recessions periods, when there was the belief that the FED had dealt with inflation successfully, and importantly, when there was simultaneously above-normal GDP growth. In 1976, growth averaged at >5% vs of c2% in the preceding years. It averaged >4% 1983-1993.
Gold price nominal (USD/oz)

Source: Macrotrends. *Shaded areas are periods of recession
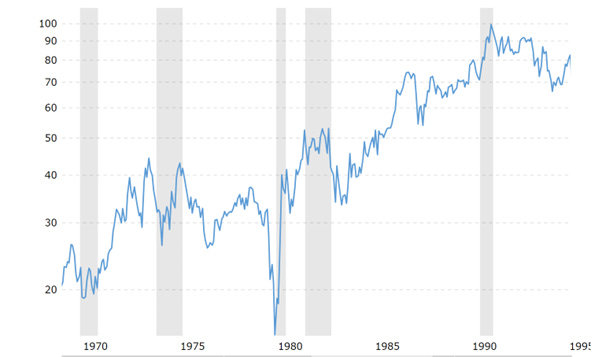
US GDP growth

Source: Macrotrends
US CPI Inflation rate

Source: Macrotrends
FED Funds rate
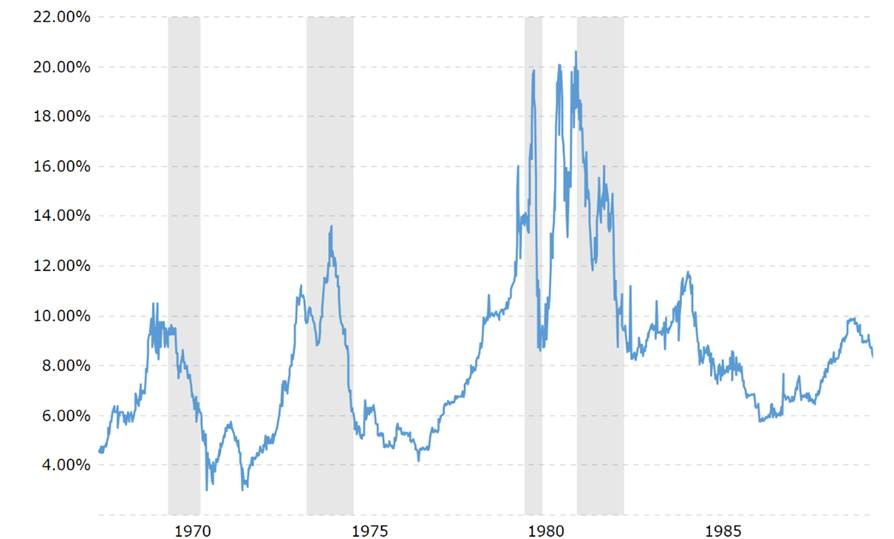
Source: Macrotrends
Reacceleration of CPI could make this gold bull market superior to 70s
Capacity for system to handle higher rates significantly constrained
The CBO estimates that US interest outlay as % of GDP will stand at c3% in the next year. That’s >50% of total deficit as % of GDP. Not only is the total deficit as % GDP higher today than it was in 1975 by c+1pp; but this despite net interest rates being at the time more than twice where they are today (6.5%). A return to similar effective net cost of debt as in 1975 would lead to a deficit as % GDP soaring to the 2008 crisis level, on our numbers (9%). But conversely this time, where nearly 3/4 of it would be composed of interest outlay. This is because federal debt/GDP tripled vs the 1970s.
US Deficit

Source: CBO
US Debt/GDP

Source: CBO
To us this means two things: a) the capacity for the FED to raise interest rates significantly and keep them high is impaired today vs what it was in the 70s and so, its capacity to deal with inflation as it did then is too (note that the Funds rates stayed high through the whole decade at >7% on average), and b) the gold price bull market could in fact be superior this time around.
Furthermore, we should stress that we have here not touched upon the US’s off-balance sheet liabilities, which if factored in, would point to a total debt figure of more than USD100trn: 3.5x GDP.
Lastly, we note that CPI prints don’t reflect the consumer inflation we personally feel, which is much higher. But CPI is the measure the market pays attention to.
Gold equities: A Win-Win
Limited downside in case of recession…
We estimate that mid-cap and smaller cap gold producers and developers run by quality management, discount a gold price today of cUSD2500-2550/oz, well below spot. This offers a safety net.
Although the perceived likelihood of a recession in the US has risen notably YTD, it is not the baseline scenario to some of the key minds on global macro. M. El Erian for example believes the US recession probability has risen to 25-30% up from 10% at the start of the year.
But just for sensitivity sake, let’s say at one point in the future, we do enter a recession. Let’s also suppose that at that point, the gold price trades at USD3000/oz. Recall the gold price peaks as we enter a recession. So, looking at history, the gold price would be expected to drop by -19% to USD2430/oz (temporary drop before recovering thereafter). We demonstrate below that the hit to equity valuations to the gold peer group would be limited. This factors in a USD2430/oz real gold price and no recovery in price thereafter for illustration purposes.
Gold equities fair value downside in event of recession
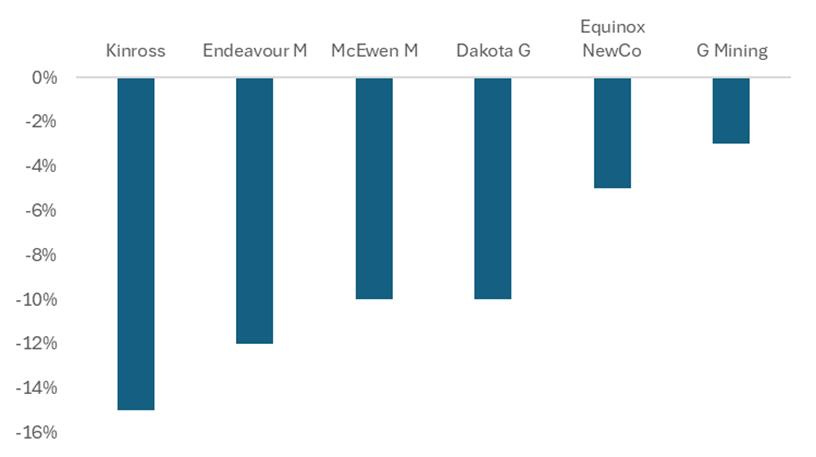
Source: Asymmetric Research
…Significant upside at spot gold, and massive optionality
We demonstrate below that at the spot price of USD2900/oz gold, and at 1x NAV, the gold peer group offers 50-140% valuation upside. The larger companies at the lower end. But Equinox Gold Newco screens particularly well offering more than a double.
At 1.5x NAV, the upsides are very substantial. P/NAV for the gold stocks was much higher historically. For North American producers for example, it averaged at 1.5x since 1985 and stood at 1.7x 1985-2008. Once the bull market is in vogue, we think such multiples will return.
Gold equities fair value upsides at USD2900/oz gold at 1x NAV, and USD3500/oz at 1.5x NAV

Source: Asymmetric Research
Gold producers P/NAV over time*

Source: FT, Scotia, Schroders. *North American gold producers
Some thoughts on Silver… should follow similar path to gold, with spurts of acceleration
Over the 70s period, silver followed gold. In fact, it showed accelerated performance vs gold in the last run up into a recession, with the gold/silver ratio contracting rapidly.
With the gold/silver price ratio currently elevated, we think we could see strong performance of silver over the next 12m, and as the gold bull market continues to establish itself. The gold stocks are much cheaper nonetheless, and we would want to play these first.
Silver price nominal (USD/oz)
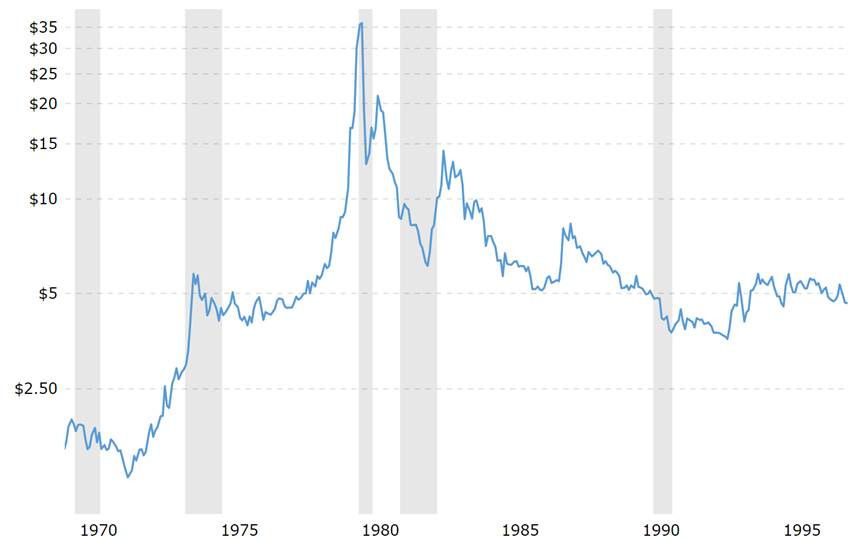
Source: Macrotrends
Gold/Silver price ratio
Source: Macrotrends