What really breaks a gold bull-run is far off
The gold price rose 17% over the past two weeks to USD3500/oz and has been the standout performer across asset classes since. Although technically it looks overbought, the overall structural trend remains higher, in our opinion. As we had written in our report Gold is heading (much) higher – 1970s playbook, stagflation proved to be very bullish gold at the time. Gold rose in nominal terms by 5x in the period 1973-83 vs S&P +50%. It even held up through recession periods, albeit with volatility. During the timeframe, the gold price ran up as inflation printed higher and ran higher into the start of recessions. What broke the gold bull-runs back then, were post-recession periods where there was: a) the belief that the FED had successfully dealt with inflation AND b) real GDP growth was trending well-above average (2x average). In our view, this is clearly far off. For a detailed analysis on this, please read our above-mentioned report from 11 March.
USD2800/oz likely the bottom in any recession induced sell-off before rapid recovery
In the 70s, during the gold bull markets, the gold price only corrected after the first rate hike within a new recession hiking-cycle, with an average price drop of -19%. However, such declines proved temporary, and the gold price then recovered entirely and almost as quickly as it fell. A repeat would send the gold price down to cUSD2800/oz, given how high spot has now reached. But again, any higher gold price still from here would mean the recession floor price would move higher too.
Select gold equities priced in for recession, with significant upside potential at current gold prices
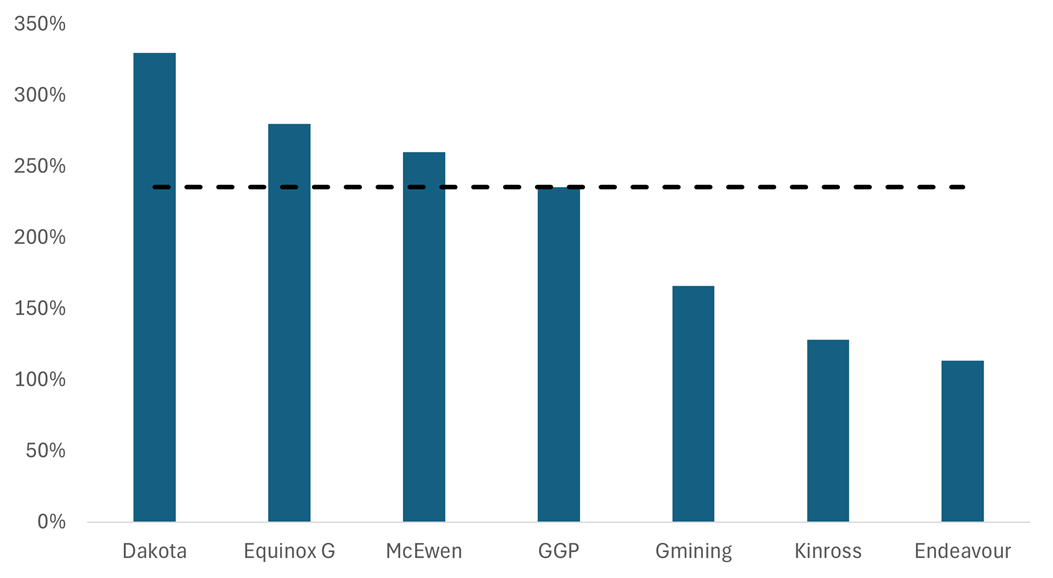
We disagree with the view that is echoing louder that it’s time to rotate out of the gold stocks. Indeed, the following gold equities peer group encompassing quality small and mid-cap gold producers and developers is pricing in on average a gold price of USD2600/oz. That’s more than 25% below spot. The bigger producers in the cohort discount USD2800/oz: the recession scenario.
Gold prices discounted in gold equities peer group, and average (USD/oz)
Source: Asymmetric Research
And while they may get cheaper still in a major market sell off, the upside the gold equities offer here even in a conservative gold bull-case of say USD3500/oz gold (spot) and assuming a 1.3x NAV multiple is of >2x on the bigger caps and >3x on the smaller ones meaning there is still plenty of juice in the long trade and any sell-offs should be bought.
Share price upsides of gold equities peer group in conservative bull-case (USD3500/oz gold and 1.3x NAV)
Source: Asymmetric Research
We should remind that gold equities traded at closer to 2x NAV historically, suggesting big additional upside optionality remains. We think such multiple will be reached when the bull market is truly in vogue.
Gold producers P/NAV over time*
Source: FT, Scotia, Schroders. *North American gold producers
Some thoughts on Silver… spurts of acceleration
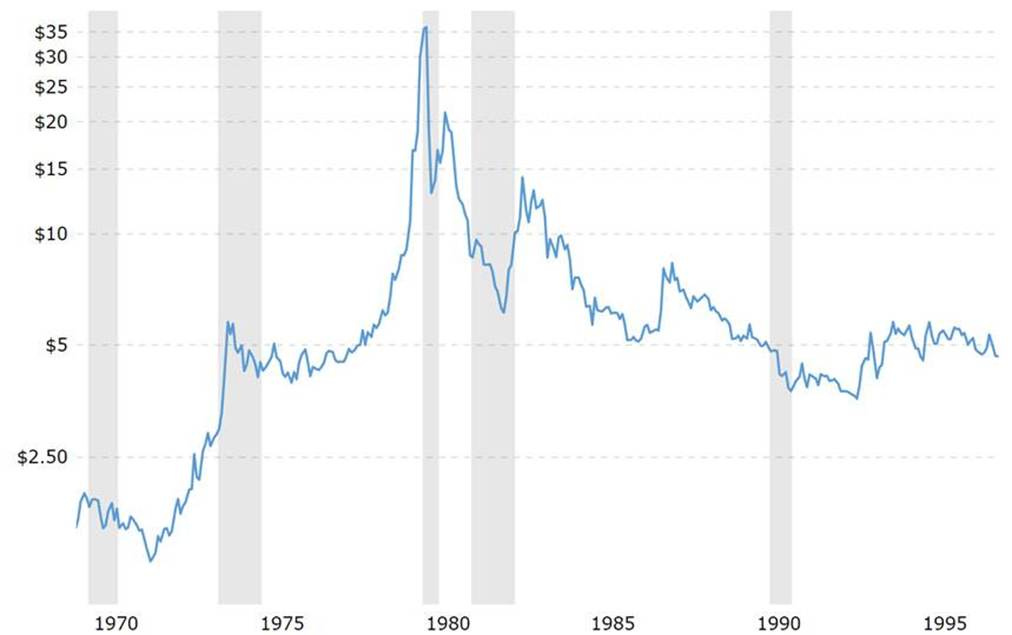
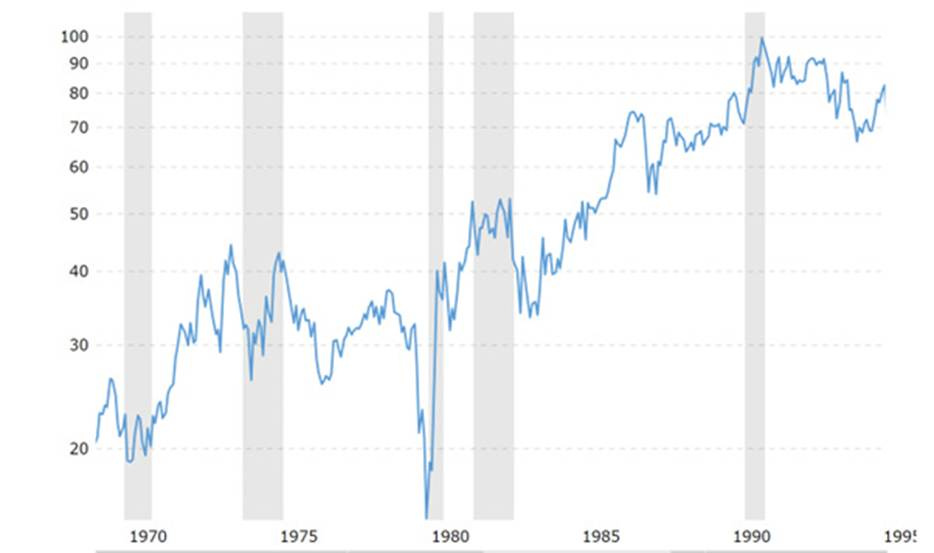
Over the 70s period, silver followed gold. In fact, it showed accelerated performance vs gold in the last run up into a recession, with the gold/silver ratio contracting rapidly.
With the gold/silver price ratio currently highly elevated (106x), we think we could see strong performance of physical silver any time now, and a performance that sustains as the gold bull market continues to establish itself. But again, with so much upside potential left in gold stocks as just described, we would play these first before moving to the silver equities.
Silver price nominal, historically (USD/oz)
Source: Macrotrends
Gold/Silver price ratio historically
Source: Macrotrends
***
These are our views only and not investment advice. We own shares in Dakota Gold, Equinox Gold, GGP and McEwen. We have not been paid by the companies for this research nor have they seen it prior to publication.


